

How to Find Stocks for Intraday Trading: Working with Finviz Filters. Part 4.
How to Find Stocks for Intraday Trading: Working with Finviz Filters. Part 4.
Previous articles:

- How to Choose Stocks for Trading: Working with Finviz. Part 1;
- How to Select Stocks on Finviz: Fundamental Parameters. Part 2;
- Stock Selection: Technical Analysis Parameters in Finviz Screener. Part 3.
An integral part of any profitable trading strategy is a well-developed stock selection algorithm. In our series of articles on stock selection using FINVIZ, we provide knowledge and understanding of how this platform can help you choose stocks that will bring more profit than loss.
Since there are quite a few strategies for intraday trading, the methods of selecting stocks will differ accordingly. In this article, we will discuss a selection method suitable for a specific strategy: "Intraday."
How to Select Stocks with Potential for Intraday Growth?
The “Intraday” trading strategy assumes trading active stocks that are moving in a specific direction (we’ll cover the long position variant). To select such stocks, you can use the following filters:
From the Descriptive Tab:
- Industry — select stocks only (only stocks), as we are not interested in exchange-traded funds (ETFs).
- Country — select USA, as the price of stocks from other countries may follow a different movement logic.
- Market Cap — select mid (under $10 billion), since this strategy does not involve trading expensive company stocks.
- Analyst Recommendation — select buy or better, as analyst recommendations will be noticed by investors. If the recommendations are positive, the likelihood of investors buying the stock increases.
- Average Volume — select over 400k, as the strategy does not involve trading illiquid stocks.
From the Fundamental Tab:
- P/E — select Profitable (>0), as companies generating profits are more stable.
- EPS Growth Next Year — select Positive (>0%), as if the company’s profit is expected to grow next year, it is more likely to have internal growth drivers.
- EPS Growth Next 5 Years — select Positive (>0%), as if the company’s profit is expected to grow over the next 5 years, it is more likely to have internal growth drivers.
From the Technical Tab:
- 20-Day Simple Moving Average — select Price above 20 SMA, as stocks whose prices are above the 20-day moving average were predominantly bought in the last 20 days. This indicates a short-term upward trend, which is crucial for this strategy.
- 50-Day Simple Moving Average — select Price above 50 SMA, as stocks whose prices are above the 50-day moving average were predominantly bought in the last 50 days. This indicates a medium-term upward trend, which is important for this strategy.
- 200-Day Simple Moving Average — select Price above 200 SMA, as companies whose stock prices are above the 200-day moving average were predominantly bought in the last 200 days. This indicates a long-term upward trend, which is key for the strategy.
- Average True Range — select Over 0.75, as it’s important that stocks are volatile enough for intraday trading.
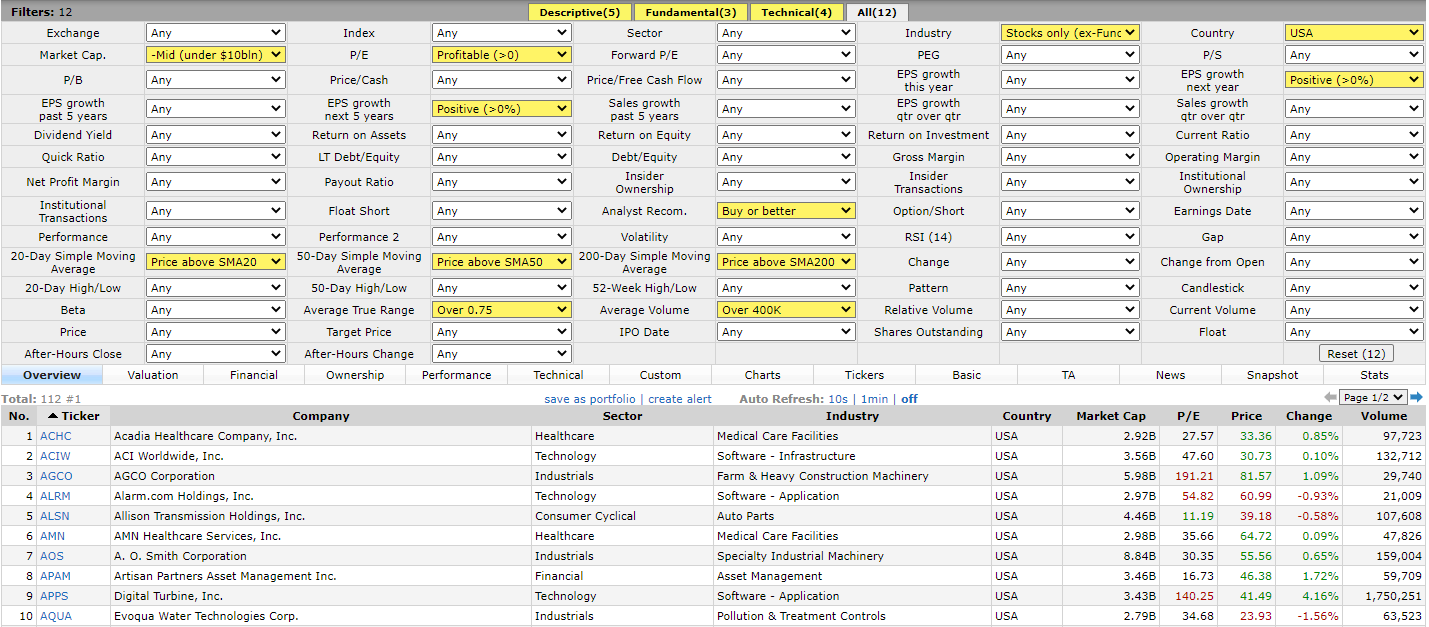
As a result, from more than 7,000 stocks, you will have just over 100 left. These selected stocks are suitable for the “Intraday” strategy, and the unnecessary ones are filtered out. This greatly simplifies life for the trader, as they will need to analyze much less information.
These filters also work for the S&P 500 correlation trading strategy—SPRINT. The only additional filter required is the Index filter, where you select S&P500, as for this strategy, you need stocks that are part of the index.
After applying the filters, we will have 5 stocks out of 500 that can be monitored during the day to find entry points for a long position using the SPRINT strategy.
Thus, you now have practical examples of using the FINVIZ screener to select stocks. You understand the logic behind the selection process, making it easier for you to create your own filters for other strategies.