

How to Select Stocks on Finviz: Fundamental Parameters. Part 2
12 February 2025
How to Select Stocks on Finviz: Fundamental Parameters. Part 2
This is the second article in the series (the first article was “How to Select Stocks on Finviz: Descriptive Parameters”). In this article, we will review all the fundamental parameters available in the FINVIZ screener.

Fundamental — a tab that contains essential ratios for the fundamental analysis of stocks: P/E (price-to-earnings ratio), P/S (price-to-sales ratio), Price/Cash (price-to-cash ratio), and others. Fundamental parameters allow you to assess a company's financial health based on indicators such as profitability, debt levels, sales growth, etc. Let's examine each of these in detail:
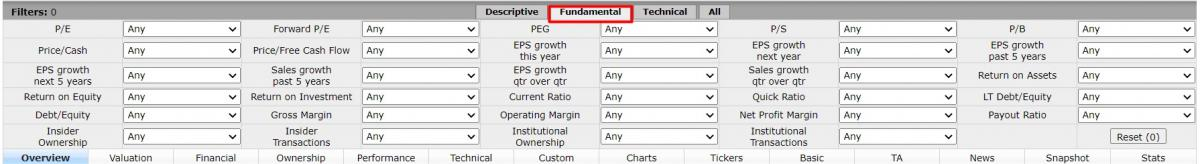
Stock Selection on Finviz - Fundamental Parameters
- P/E (price-to-earnings ratio) — you can select the ratio of the current price to the EPS (annual profit of the company divided by the number of shares outstanding). The screener will filter stocks with a P/E ratio higher or lower than a set level or within a defined range.
- Forward P/E (forecasted future P/E ratio) — you can select the ratio of the current price to the expected future EPS. The screener will filter stocks with a Forward P/E ratio higher or lower than a set level or within a defined range.
- PEG (price-to-earnings-to-growth ratio) — you can select the ratio of the current P/E to the EPS growth over the next 5 years (expected EPS growth in the next 5 years). The screener will filter stocks with a PEG ratio higher or lower than a set level or within a defined range.
- P/S (price-to-sales ratio) — you can select the ratio of the current price to “revenue per share.” The screener will filter stocks with a P/S ratio higher or lower than a set level or within a defined range.
- P/B (price-to-book ratio) — you can select the ratio of the current price to “book value per share” (assets minus liabilities). The screener will filter stocks with a P/B ratio higher or lower than a set level or within a defined range.
- Price/Cash (price-to-cash ratio) — you can select the ratio of the current price per share to “cash holdings per share.” The screener will filter stocks with a Price/Cash ratio higher or lower than a set level or within a defined range.
- Price/Free Cash Flow (price-to-free-cash-flow ratio) — you can select the ratio of the current price per share to “free cash flow per share” (cash remaining after capital expenditures). The screener will filter stocks with a Price/Free Cash Flow ratio higher or lower than a set level or within a defined range.
- EPS growth this year — you can select the growth rate of EPS over the past year compared to the previous year. The screener will filter stocks with an EPS growth rate higher or lower than a set level or within a defined range.
- EPS growth next year — you can select the expected EPS growth rate for the next year compared to the past year. The screener will filter stocks with an EPS growth rate higher or lower than a set level or within a defined range.
- EPS growth past 5 years — you can select the average annual EPS growth rate over the past 5 years. The screener will filter stocks with an EPS growth rate higher or lower than a set level or within a defined range.
- EPS growth next 5 years — you can select the expected average annual EPS growth rate over the next 5 years. The screener will filter stocks with an EPS growth rate higher or lower than a set level or within a defined range.
- Sales growth past 5 years — you can select the average annual sales growth rate over the past 5 years. The screener will filter stocks with a sales growth rate higher or lower than a set level or within a defined range.
- EPS growth quarter over quarter — you can select the EPS growth rate in the most recent quarter compared to the same quarter last year. The screener will filter stocks with an EPS growth rate higher or lower than a set level or within a defined range.
- Sales growth quarter over quarter — you can select the sales growth rate in the most recent quarter compared to the same quarter last year. The screener will filter stocks with a sales growth rate higher or lower than a set level or within a defined range.
- Return on Assets (ROA) — you can select the ratio of net annual profit to the company’s assets. The screener will filter stocks with an ROA higher or lower than a set level or within a defined range.
- Return on Equity (ROE) — you can select the ratio of net annual profit to the company’s equity. The screener will filter stocks with an ROE higher or lower than a set level or within a defined range.
- Return on Investment (ROI) — you can select the ratio of net annual profit to the invested capital in the company. The screener will filter stocks with an ROI higher or lower than a set level or within a defined range.
- Current Ratio — you can select the ratio of current assets to current liabilities. The screener will filter stocks with a Current Ratio higher or lower than a set level or within a defined range.
- Quick Ratio — you can select the ratio of current assets minus inventories to current liabilities. The screener will filter stocks with a Quick Ratio higher or lower than a set level or within a defined range.
- LT Debt/Equity (long-term debt-to-equity ratio) — you can select the ratio of long-term liabilities to equity. The screener will filter stocks with an LT Debt/Equity ratio higher or lower than a set level or within a defined range.
- Debt/Equity (debt-to-equity ratio) — you can select the ratio of total liabilities to equity. The screener will filter stocks with a Debt/Equity ratio higher or lower than a set level or within a defined range.
- Gross Margin — you can select the ratio of gross profit (gross profit = revenue - cost of goods sold) to revenue. The screener will filter stocks with a Gross Margin higher or lower than a set level or within a defined range.
- Operating Margin — you can select the ratio of operating profit (operating profit = gross profit - operating expenses - depreciation/amortization) to revenue. The screener will filter stocks with an Operating Margin higher or lower than a set level or within a defined range.
- Net Profit Margin — you can select the ratio of net profit to revenue. The screener will filter stocks with a Net Profit Margin higher or lower than a set level or within a defined range.
- Payout Ratio — you can select the ratio of dividends paid to net profit. The screener will filter stocks with a Payout Ratio higher or lower than a set level or within a defined range.
- Insider Ownership — you can select the proportion of the company owned by management. The screener will filter stocks with an Insider Ownership ratio higher or lower than a set level or within a defined range.
- Insider Transactions — you can select the percentage change in the proportion of the company owned by management over the past 6 months. The screener will filter stocks with an Insider Transactions ratio higher or lower than a set level or within a defined range.
- Institutional Ownership — you can select the proportion of the company owned by institutional investors. The screener will filter stocks with an Institutional Ownership ratio higher or lower than a set level or within a defined range.
- Institutional Transactions — you can select the percentage change in the proportion of the company owned by institutional investors over the past 6 months. The screener will filter stocks with an Institutional Transactions ratio higher or lower than a set level or within a defined range.